
To the sound of bugles bicycle bells, the Council Annual plan 2016-2017 arrived yesterday.
Wrapped up with the 2015-2016 proposal is the “Draft Low Carbon Capital Plan,” where we minions get until 29th April to hand in our feedback.
“2016 Low Carbon Capital Plan – adoption of a plan to reduce emissions in a constructive and business-friendly way. The plan details how the Council plans to reduce carbon emissions in the city and from Council operations.”
Open up the Low Carbon plan and you get an angel riding a bicycle. I think it’s an angel, I can’t be sure from that angle. They do appear to have a bell though so that’s nice.

The 2016 Low carbon plan is 46 pages of stuff that has already been said 3 years ago in the 2013 climate change plan.
Anyway….open up page 10 of the 2016 Low Carbon Plan and it says….
Page 10: “On the other hand, we have a major international airport within the city limits, so we are credited with the emissions of nearly all of the region’s domestic air travel. This creates multiple complex challenges – with less forestry we aren’t able to offset as much; and with aviation being a substantial contributor to our transport emissions, greenhouse gas reductions will be driven by the availability of international solutions for aviation such as biofuels or gains in aircraft efficiency.“
Basically saying throw your hands up in the air because there is nothing you can do about it at a council level. Sounds like the basin reserve.
This is on par with the 2013 Climate Change Plan on pages 38 & 39 where it says ‘major shareholder, nothing we can do, the airlines themselves will sort it yada yada.’
The 2013 Climate Change Plan also shows this chart showing the Wellington City greenhouse gas inventory 2009/2010 with aviation pumping out 199.8 kT CO²-e & 17.5% of total emissions in Wellington.

The 2013 Climate Change plan does actually say, “The Council will work with the airport to assess the climate change impacts of the runway extension and identify mitigation opportunities.“ So do keep an eye out for what that is amongst the $500 BAZILLION in economic benefits.
In the ‘2016 draft low carbon plan,’ it has 46 pages and it only mentions aviation twice, the rest is token gestures on silly targets. Note they didn’t hit the 2013 target. Whoops.
Page 15: “However we failed to meet our 2013 target of a 3% reduction in emissions with the city registering a 1.5% increase for that period.“
Cripes, up 1.5%, better get the local industrial people to do some carbon swaps on the exchange then.
Point is, where do these numbers come from? If the local boy racers leave their cars running in the car park, who is standing next to the exhaust collecting CO² particles?
No one. It’s all statistical modelling in excel 2013. Probably.
The table below is the current council website for emission targets for 2013. I cannot work out where they have got these figures from, they do not tally anywhere.
Every other number shown post 2013 has been lifted from the 2014 URS Greenhouse gas inventory report, a report with the councils name on it. “Prepared for Wellington City Council.”
Council website http://wellington.govt.nz/services/environment-and-waste/environment/climate-change/greenhouse-gas-emission-reduction-targets

Look at Aviation on the council chart, already up to 19% and 244 thousands of tonnes of CO² in only 3 years. Remember the 2009/10 figure was 17.5% and 199.8 thousands of tonnes of CO² ?
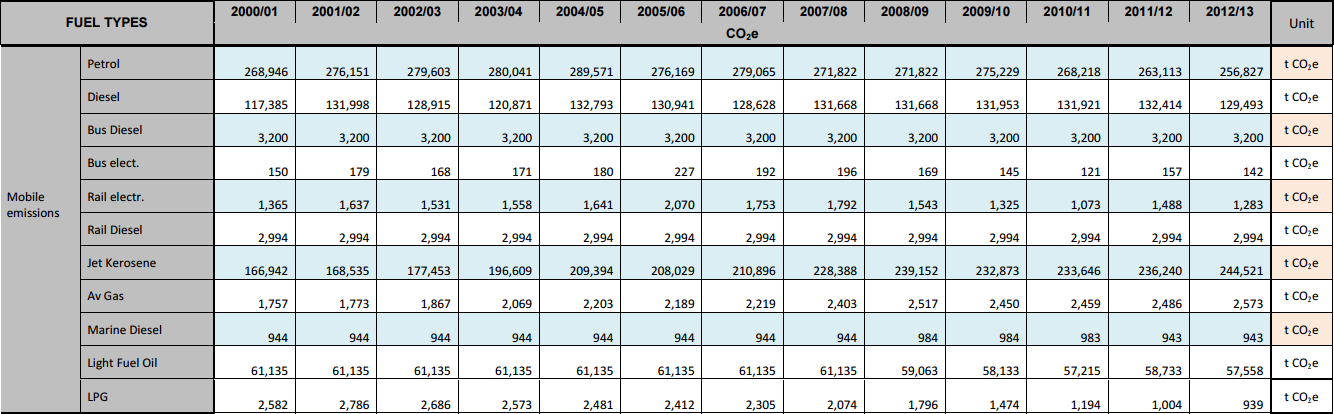
Now go to the council commissioned 2014 URS Greenhouse gas inventory report and have a look at this table for Wellington City..
If you squint the only thing that tallies with the council figure is the domestic aviation figure 244 thousand tonnes in 2012/13.
This is ‘APPENDIX B WELLINGTON CITY EMISSIONS OVERVIEW.’
Can anyone get in touch and tell me where the council got their figures for their chart on their website, because their figures do not tally with the 2014 URS report?
- For 2012/13, if you add up petrol, diesel, bus diesel, bus elec, rail elec, rail diesel, light fuel, lpg you get 453 thousand tonnes.
Is that what the council have put down as their 2013 455 thousand figure for land transport?
- Do the same for 2009/10, add up petrol, diesel, bus diesel, bus elec, rail elec, rail diesel, light fuel, lpg you get 474 thousand tonnes (not including marine diesel at 0.943).
In the councils chart it shows all transport minus aviation at 397 thousand tonnes…..Who knows what is going on here please?
Anyway, have a look at these from the 2014 URS greenhouse gas report…
- Aviation emissions rising
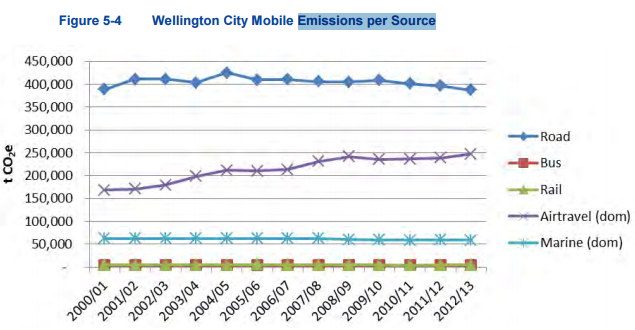
2. Aviation has increased 50% from 2001, almost equal to petrol emissions.
Page Summary XV: “Regional emissions from aviation have increased by approximately 50% from 2000/01 levels. For Wellington City, aviation emissions are almost equal to that of petrol emissions.“
3. Aviation figures do not include international travel
Page Summary X: “Due to data limitations, the study does not assess emissions from international aviation and international shipping.“
4. Data based on 2006/07 fuel usage & international travel missing which is another ~25% on top which makes aviation ~305 thousand tonnes of CO².
Page 30: Chart showing aviation, fuel data from 2006/07, no international travel, which we are told expanded 11% this year 2015-2016.

5. Self explanatory
Page 73: “Reductions in petrol and marine fuel use were offset mostly by an increase in aviation fuel use.“
6. No international aviation emissions
Page 84: “Emissions from domestic aviation have increased significantly over the reporting period. The same is expected for international air travel. However, at this stage, emissions from international aviation have not been included, due to lack of data. This may represent a significant source of emissions for the Wellington City GHG Inventory and the Wellington Region as a whole.“
7. Airtravel emissions on the up

But what does this all mean Adam?
This stuff is only a poke at statistical modelling. Who knows what the real picture is, there is only the one 2014 URS report. Whilst keen on geography, I am not a scientist, can we be sure this is anything like reality? It’s guesswork right?
You are not being shown accurate aviation data in any of the councils papers because there is no international flight emission data. I repeat, NO INTERNATIONAL flight emission data. We know in the last year international flights increased 11% alone.
Aviation is only shown for domestic travel, so all of the council papers above where it says aviation is ‘17.5% or 18% or 19% of total emissions,’ is total bullshit.
If you pull in what URS guesstimate it could be, ~305 thousand tonnes of CO² which puts aviation at 23% of total emissions using the council website figures.
In 2013 nearly a quarter of all CO² emissions in Wellington are flights in and out of the airport.
The next greenhouse gas report is due out next month, let’s see what it includes this time around and what the figures are and what the council puts out.
So whilst everyone is obsessed with the look-at-me-I’m-so-green, I-am-greener-than-you, bicycle PR sideshow, can we have a proper discussion about what the airport emissions actually look like please?
